Hello. I am Oluwarotimi
Data Analyst | Operational Analytics
About Me

I am a Data Analyst with experience analysing operational data to support informed decision-making. Leveraging SQL, Power BI, and Excel, I develop reports, dashboards, and data-driven solutions that help organizations understand performance, identify trends, and uncover opportunities for improvement.





Projects
An end-to-end data pipeline and deployed machine learning tool that predicts whether a supply chain order is at risk of arriving late.

Insight into the relationship expressed over time between climate factors and their effects
on crop production

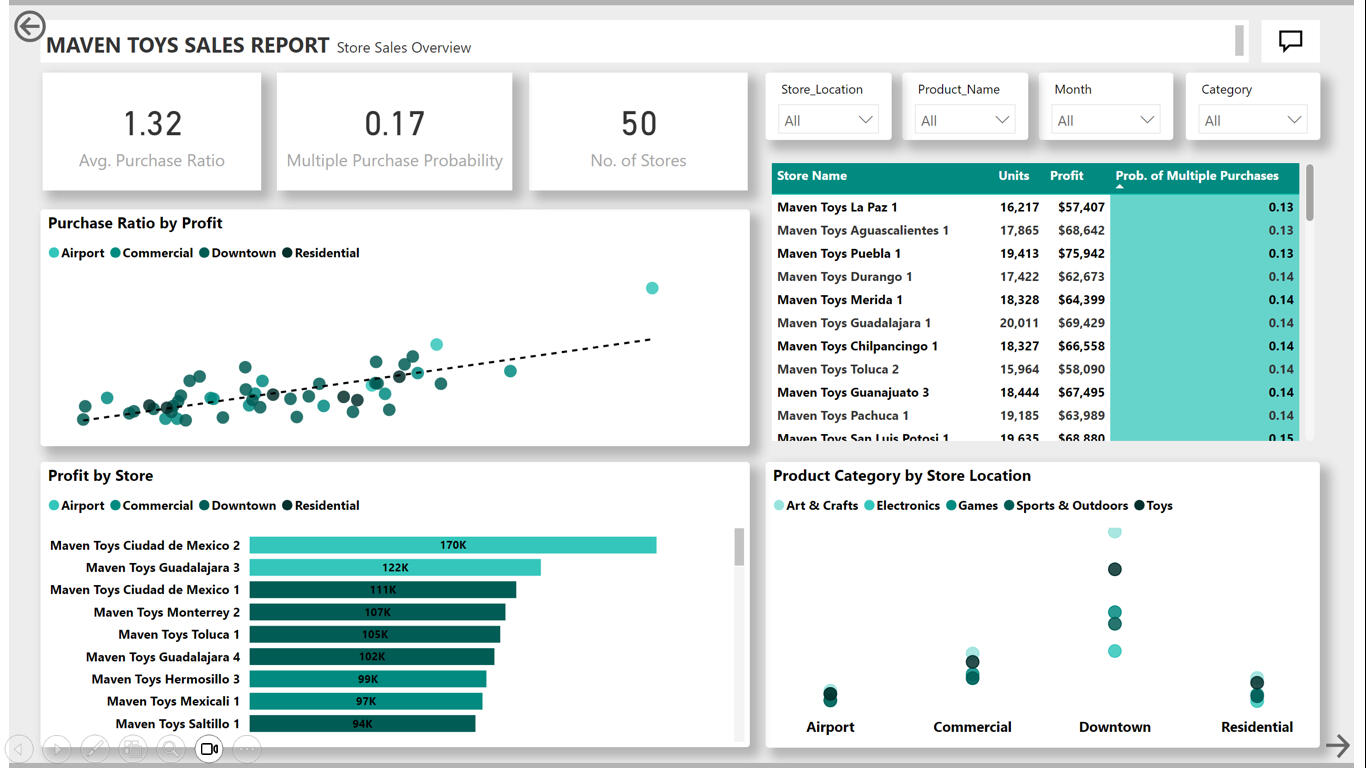
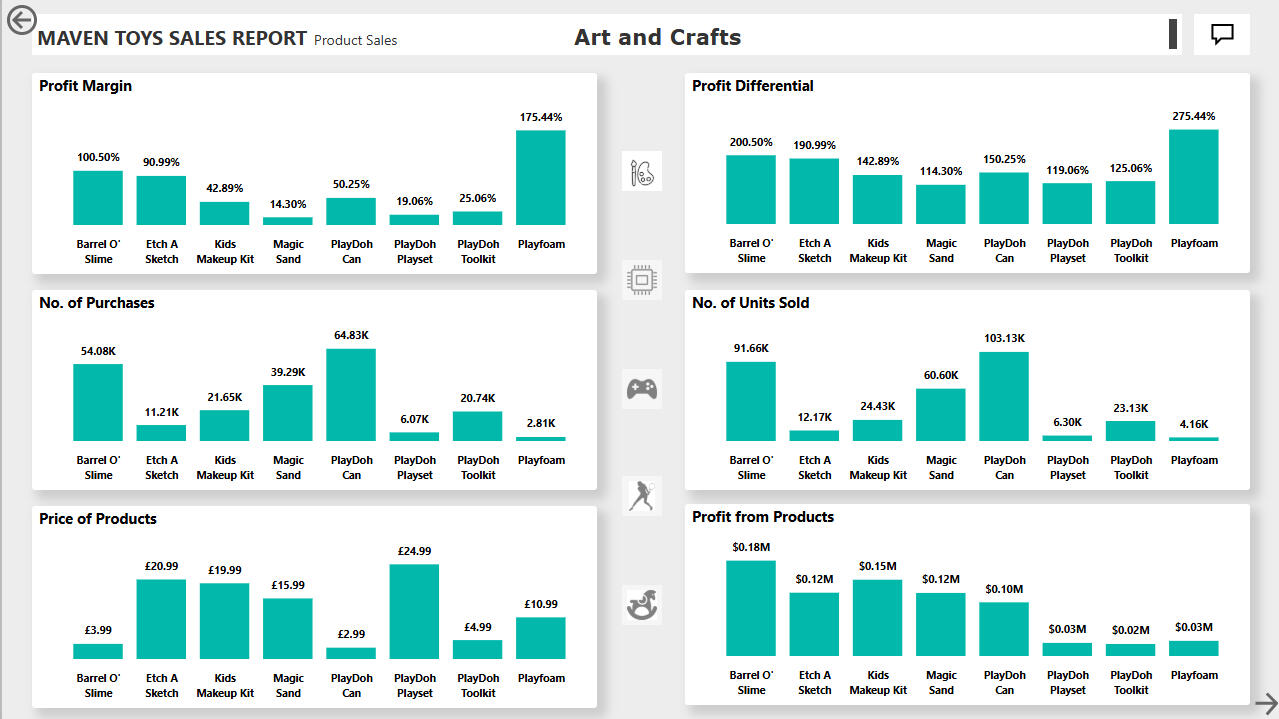
An analysis of sales, product performance, and customers interaction with various toy categories of Maven Toys.
Late Delivery Risk Predictor
OverviewThis project builds a complete pipeline, from raw order data to a live, interactive prediction tool, around a single operational question: can an order's delivery risk be estimated before it ships, using only the information available at the time it's placed?Rather than a broad exploratory analysis, this project was scoped deliberately as a data engineering and model-building exercise: structuring raw data into a proper relational database, engineering a clean and leakage-free feature set through evidence-based analysis, training and evaluating a classification model, and deploying it as a usable web application.Tech Stack
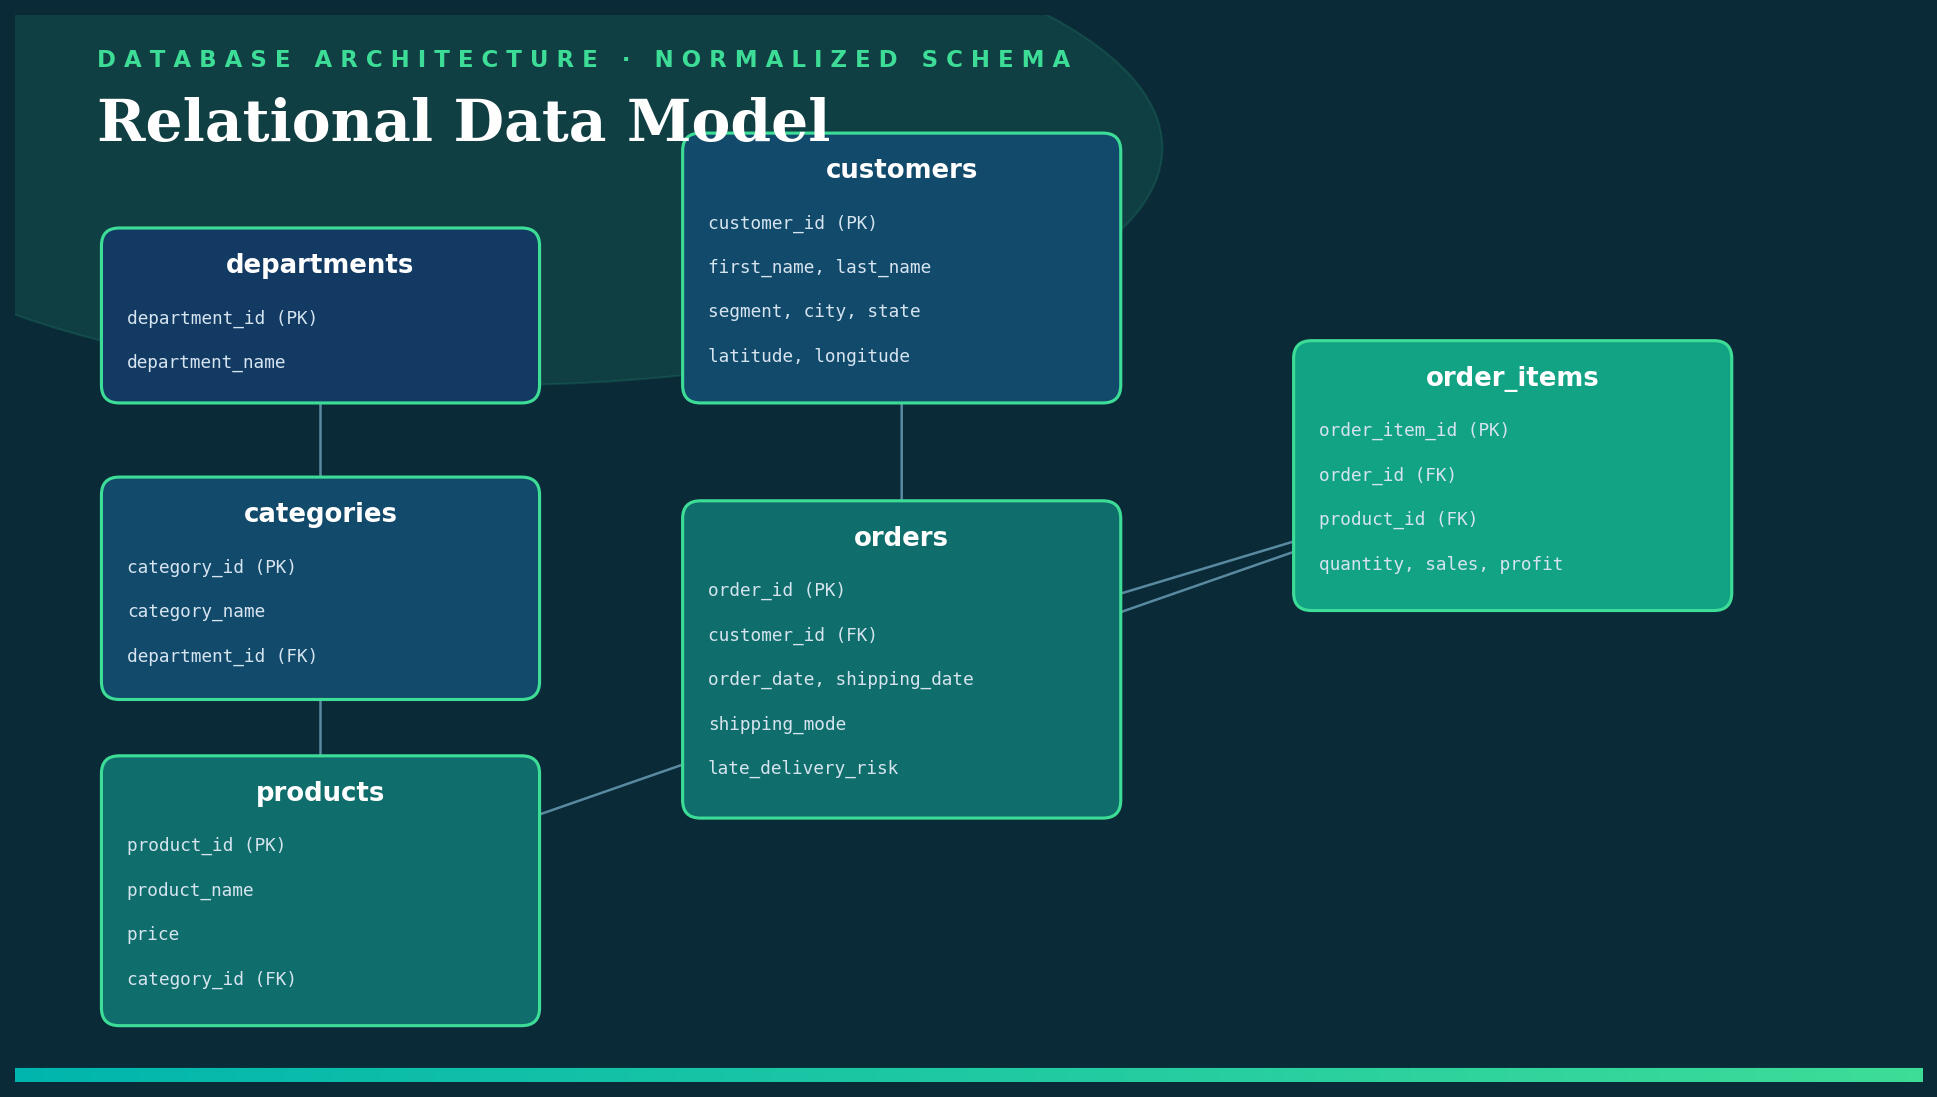
Python MySQL pandas scikit-learn Streamlit GitHubData EngineeringThe source data, the DataCo Smart Supply Chain dataset (~180,000 order records, Kaggle), arrived as a single flat CSV. Rather than working from that directly, it was restructured into a normalized MySQL schema: six related tables (customers, products, categories, departments, orders, order_items) connected by foreign keys, mirroring how a real operational database would be structured.Every foreign key relationship was validated against the full dataset after the split, zero orphaned records across ~247,000 rows.
Data CleaningUsing pandas, the data was pulled back from MySQL via a SQL join, checked for missing values (minimal, under 10 rows across two fields), and prepared for analysis:
- delay_days engineered as the gap between scheduled and actual shipping time
- Canceled orders (4.3% of the data) flagged rather than deleted, since their delivery outcome is not meaningful for a "was it late" analysis, but the data remains available for other usesFeature Engineering & Selection
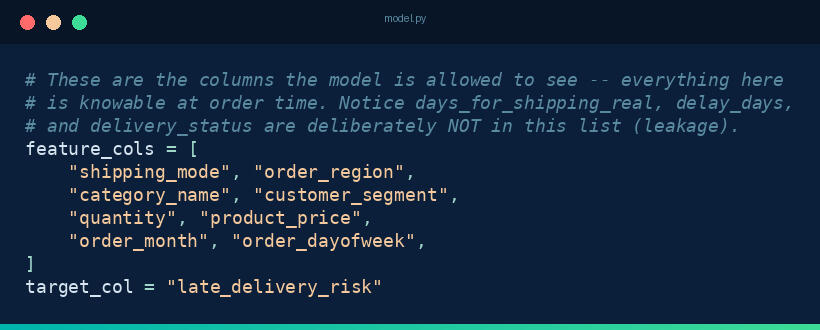
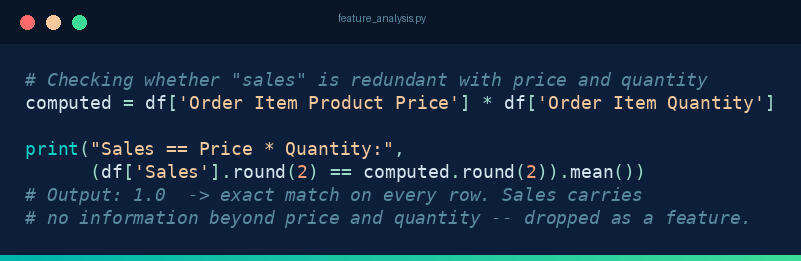
This was the most rigorous stage of the project. Every candidate feature was evaluated on two criteria: would this information actually be available at the time an order is placed, and does it carry information no other feature already captures.Leakage exclusion: fields that only exist after a delivery outcome is known — delivery_status, delay_days, actual shipping duration — were excluded entirely. Including them would let the model "see the answer."Redundancy elimination: several features initially included were later dropped after direct evidence they added nothing:- sales was found to be an exact function of price × quantity (100% match) — dropped
- market was fully redundant with the more granular order_region — dropped
- department_name was redundant with category_name — dropped
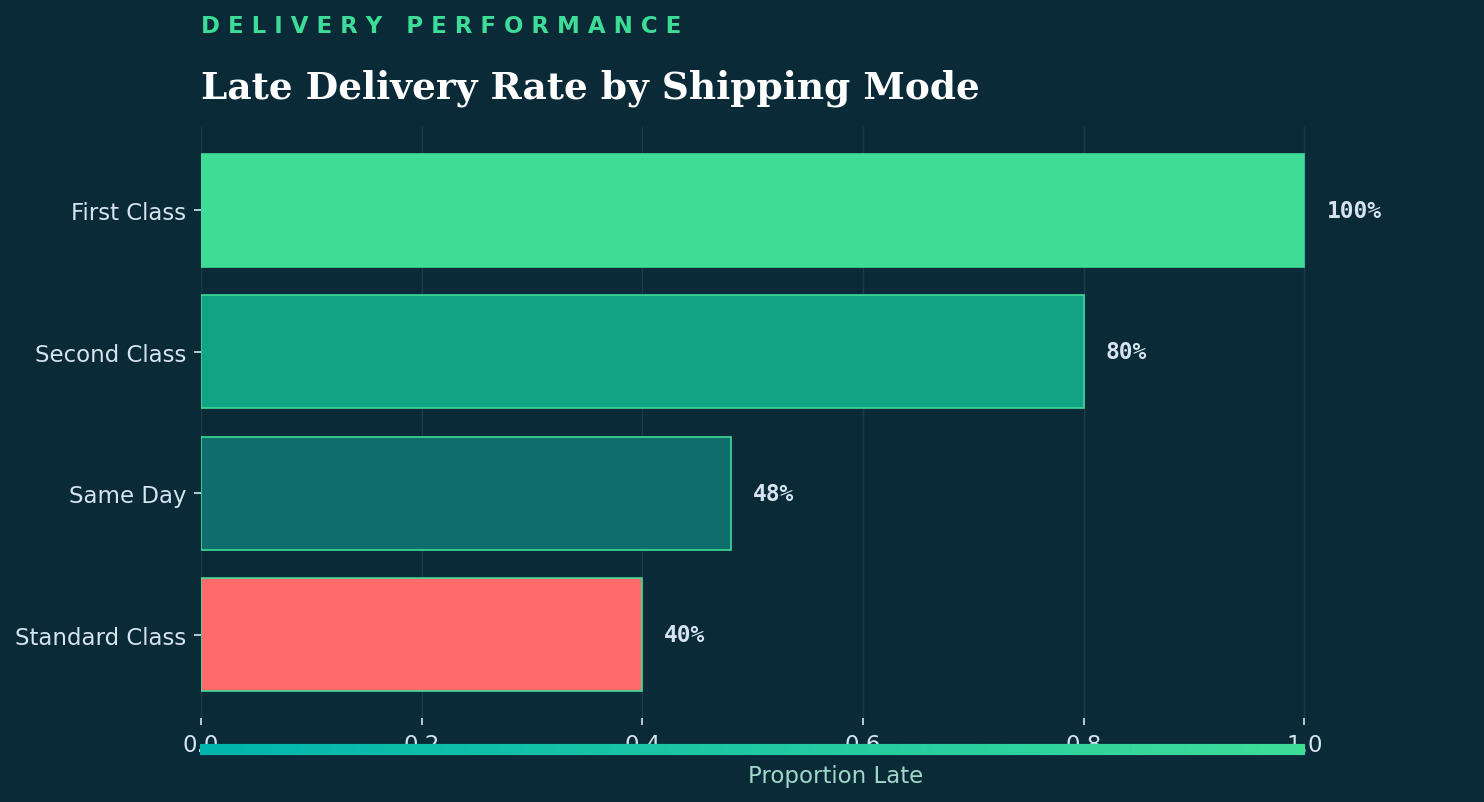
- days_for_shipment_scheduled was a deterministic function of shipping_mode — dropped
- discount_rate showed a correlation of 0.001 with the target — dropped after confirming no relationship, direct or indirectThe final model uses 8 features, down from an initial 13 — each retained only after being shown to carry independent, legitimate signal.
Modeling & EvaluationTwo classifiers were trained and compared: Logistic Regression (interpretable baseline) and Random Forest (non-linear).
| Model | Accuracy | Precision (Late) | Recall (Late) | F1 |
|---|---|---|---|---|
| Logistic Regression | 69.7% | 83% | 59% | 0.69 |
| Random Forest | 70.4% | 87% | 57% | 0.69 |
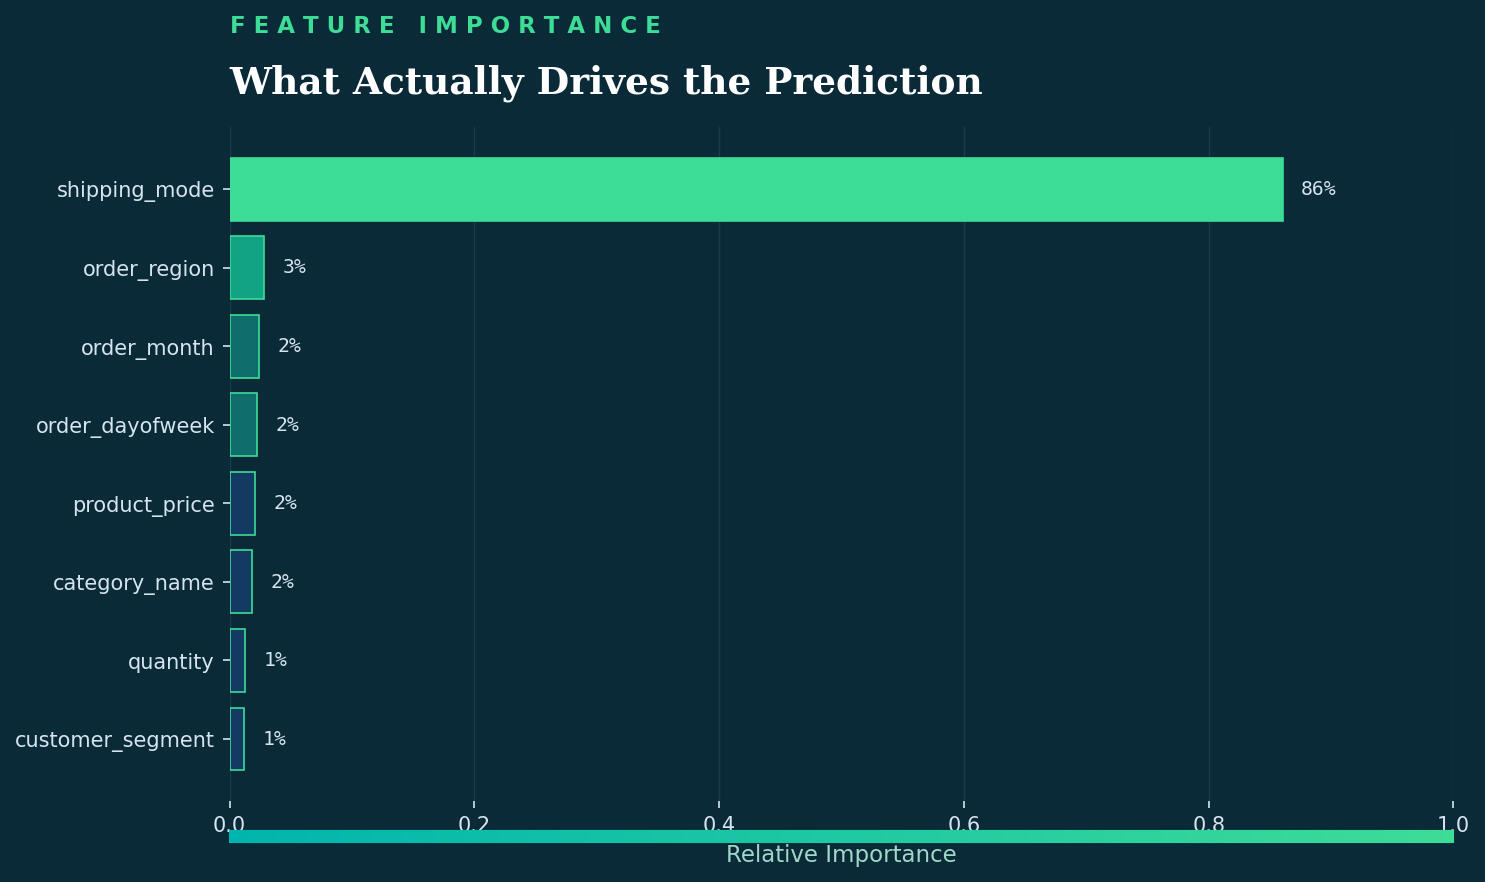
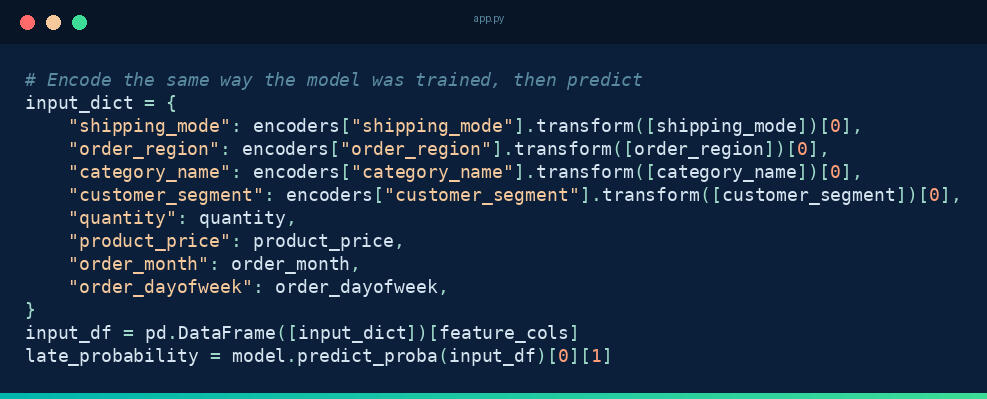
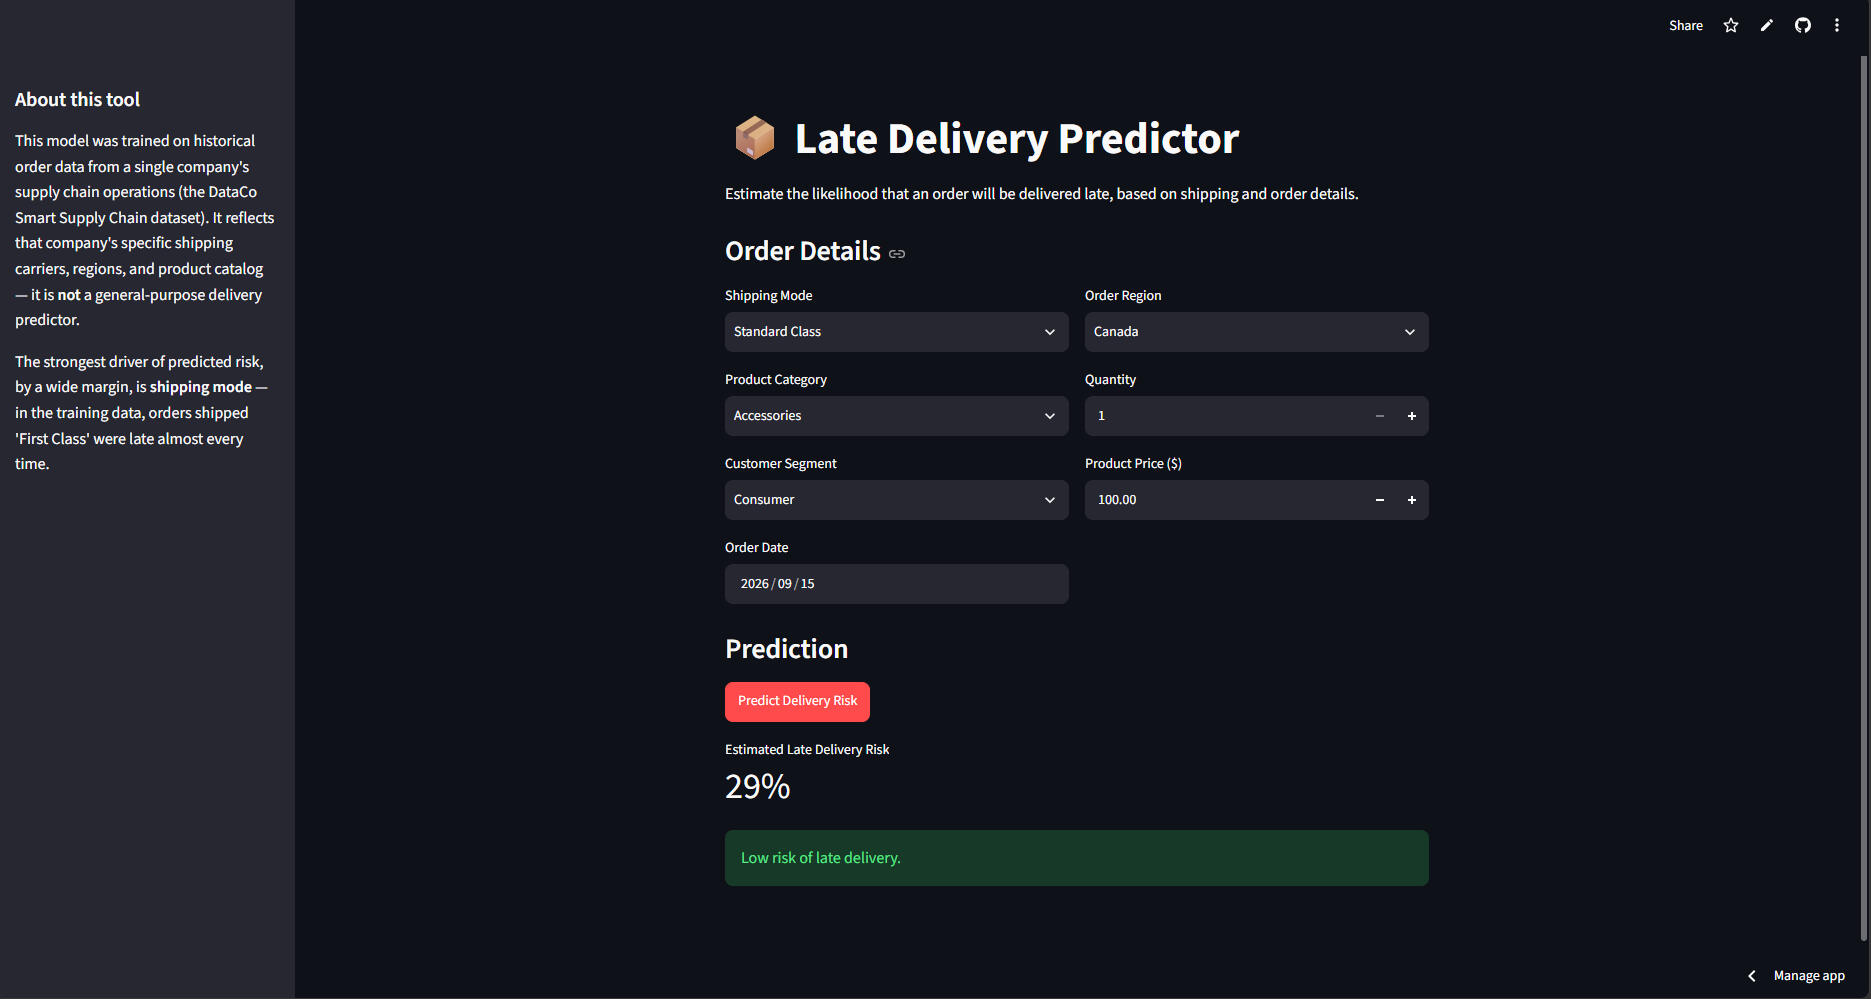
Honest finding: shipping_mode accounts for roughly 86% of the Random Forest's predictive weight — this is a model that has learned, above all else, that how an order is shipped is by far the strongest indicator of whether it arrives late. This is stated plainly rather than implying a broader multi-factor prediction than the data actually supports.DeploymentThe trained model was serialized and wrapped in a Streamlit web application — allowing anyone, not just someone comfortable with Python, to select an order's details from dropdowns and receive an instant delivery-risk estimate.
Key DecisionsLeakage prevention: explicitly excluded any feature only knowable after delivery
Canceled orders: flagged, not deleted — preserved for other potential uses rather than silently discarded
Feature redundancy: every feature justified with a direct data check, not intuition
Scope honesty: the model's ~86% reliance on one feature is reported directly, not smoothed over
Scope & Future WorkThis project prioritized data engineering and model-building rigor over exploratory analysis. Natural next steps:- A Power BI dashboard for descriptive delivery-performance reporting
- Deeper exploratory analysis of secondary factors
- Testing gradient-boosted models (XGBoost/LightGBM) against the current baseline
- One-hot encoding in place of label encoding for the Logistic Regression model
AFRICAN CLIMATE AND CROP PRODUCTION ANALYSIS
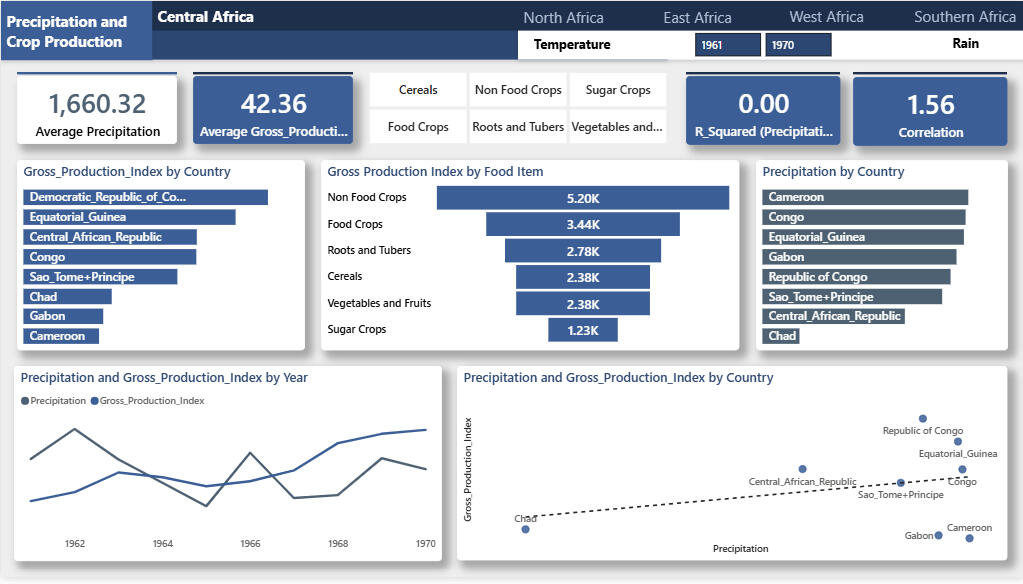
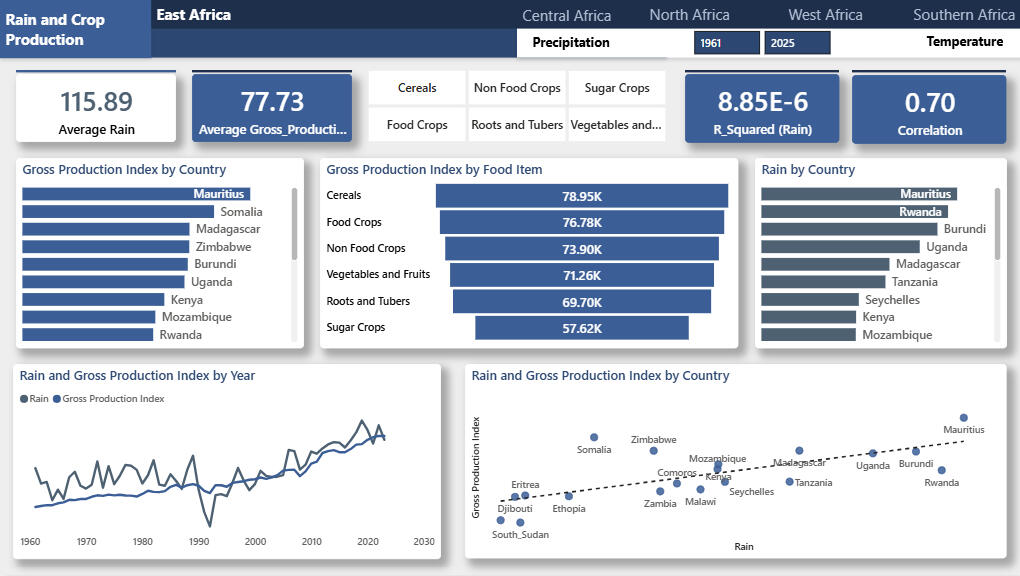
Project OverviewAgriculture is highly dependent on climate conditions, making environmental factors such as precipitation, rainfall, and temperature critical determinants of crop productivity. This project explores the relationship between climate variables and agricultural production across Africa's major regions using an interactive Power BI dashboard.The objective was to identify climate patterns, examine their relationship with crop production, and provide insights that can support agricultural planning and decision-making.Business Questions• How do precipitation, rainfall, and temperature vary across African regions?
• What relationship exists between climate conditions and crop production?
• Which climate variables appear to have the strongest influence on agricultural output?
• How do regional climate differences impact agricultural performance?Key Findings• Climate conditions vary significantly across African regions, creating distinct agricultural opportunities and challenges.• Precipitation and rainfall show observable relationships with crop production, highlighting the importance of water availability for agricultural success.• Temperature fluctuations appear to influence agricultural performance, particularly in regions exposed to more extreme climate conditions.• Correlation analysis indicates measurable relationships between climate variables and crop output, demonstrating the impact of environmental factors on agricultural productivity.• Regional differences suggest that agricultural policies and climate adaptation strategies should be tailored to local environmental conditions rather than applied uniformly across the continent.Business ImpactThis analysis provides a data-driven framework for understanding how climate conditions influence agricultural performance. The insights can support agricultural planning, climate adaptation initiatives, food security strategies, and resource allocation decisions by helping stakeholders identify environmental risks and opportunities.
MAVEN TOYS SALES PERFORMANCE ANALYSIS
Project OverviewMaven Toys is a retail toy company operating across multiple store locations and product categories. This project analyzes sales performance, product trends, category performance, and store-level results through an interactive Power BI dashboard. The objective was to identify revenue drivers, evaluate product and category performance, uncover sales trends over time, and provide insights that can support inventory planning, merchandising decisions, and overall business growth.Business Questions• Which product categories generate the highest sales performance?
• How do sales trends change over time?
• Which stores are performing above or below expectations?
• Which products contribute most to revenue generation?
• How does product performance vary across store locations?
• What opportunities exist to improve sales and inventory decisions?Key Findings• Sales performance varies significantly across product categories, indicating that certain categories contribute disproportionately to overall revenue.• Product demand is not evenly distributed, with a relatively small number of products driving a substantial share of sales performance.• Sales trends fluctuate over time, highlighting seasonal patterns and periods of increased customer demand.• Store performance differs across locations, suggesting opportunities to identify best-performing stores and replicate successful practices.• Product performance varies by location, indicating that customer purchasing behavior differs between stores and markets.• Performance monitoring at both product and store levels can help improve inventory allocation and reduce the risk of overstocking or stock shortages.Business ImpactThis dashboard provides a centralized view of sales performance across products, categories, and store locations. The analysis enables stakeholders to make data-driven decisions regarding inventory management, product assortment, store operations, and revenue optimization.
By identifying top-performing products, categories, and stores, the business can better allocate resources, improve operational efficiency, and support future growth initiatives.